


Weekly Market Commentary July 13, 2026
LPL Research examines how sticky inflation, Fed leadership changes, and AI-driven borrowing are shaping the fixed income outlook for 2026.

Last Edited by: LPL Research
Last Updated: July 13, 2026
Keep Calm and Clip Coupons
Coming into 2026, we expected inflation to move closer to the Federal Reserve's (Fed) 2% target, the Fed to cut rates by roughly 75 basis points (bps), and Treasury yields to drift lower. Instead, the first half delivered three stress tests in rapid succession: a leadership change at the Fed, a geopolitical shock that sent oil prices and yields surging, and an AI buildout that is having a measurable impact on the corporate bond market — with the Fed leadership transition among one of our key themes for the balance of the year. While these tests are likely to linger throughout the rest of 2026, starting yields are still comfortably above their long-term averages. At current yields, carry alone offers a meaningful cushion, allowing bond investors to keep calm, collect coupons, and carry on. Here, we discuss the fixed income market landscape and our expectations for the second half, as covered in our Midyear Outlook 2026: Policy, Buildouts, & Bottlenecks.
A Fed Chair Without a Grace Period
As we develop the outlook for the next few quarters, we must assume a more challenging period for the Federal Open Market Committee (FOMC) and its new chairman, Kevin Warsh. In our view, Warsh will likely experience only a brief honeymoon period as he steps into his new role given inflation remains stubbornly sticky, particularly in core categories, limiting the Fed's flexibility and exposing policymakers to potential criticism if progress stalls. At the same time, the ongoing Iran conflict introduces geopolitical risk that keeps energy markets volatile and inflation expectations elevated. With the crisis extending past 100 days — and potentially receiving an extension after last week's strikes — continued disruption of the Strait of Hormuz risks compounding price pressures, leaving Warsh to inherit a policy environment where exogenous shocks, not just domestic demand, are shaping the inflation trajectory. In that context, market participants would be less patient, and the usual grace period for new leadership could vanish almost immediately.
Consumer inflation data underscores just how difficult the path back to price stability will be. The most recent core inflation print from May rose 0.2% month over month, keeping the annual rate just under 3%, which is psychologically important but still meaningfully above the Fed's 2% target. Headline inflation climbed to 4.2% year over year, the highest since mid-2023. Inflation was driven heavily by rising gasoline and energy costs. While energy is often volatile, the concerning element is broader pressure in services, particularly medical care, which continues to push higher even as health insurance costs have moderated over the past six months. Transportation costs are another stress point, reflecting both strong travel demand and elevated fuel prices. This mix of resilient demand and supply-side shocks creates a "no easy wins" backdrop for policymakers, where inflation declines only gradually and unevenly.
In short: the deeper challenge for Warsh — and for the Fed more broadly — lies in the persistence of services inflation. Services inflation is slower to adjust, and sustained progress toward the 2% target will require a meaningful cooling in services, which remains elusive. The risk in the current environment is that prolonged geopolitical stress keeps energy prices elevated through the summer, amplifying second-order effects across sectors and complicating the Fed's policy calculus, leaving rates on hold as a result.
As such, with a Fed likely on a prolonged pause, we believe that likely means Treasury yields will remain range-bound in the second half of 2026. We think the 10-year settles into a 4.0–4.5% range throughout the rest of the year. Also, the additional compensation (spreads) to own corporate credit remains muted. Though, we could see upward pressure on spreads for the hyperscaler companies that are leaning into the debt markets to fund the AI infrastructure buildout. However, with still high yields and a higher-quality composition, we don't expect corporate credit spreads to widen much from current levels. So, with little potential price appreciation through falling Treasury yields and/or spread tightening, in our view, returns will once again come from attractive income opportunities, which remain historically attractive.
A New Regime at the Fed
Additionally, the early May handover from Jerome Powell to Kevin Warsh as Fed Chair represented a meaningful philosophical shift at the central bank. Warsh, a former Fed governor and investment banker, has long pushed for a smaller Fed footprint. His prescription: a smaller balance sheet, fewer promises about the future path of rates, and more room for markets to discover prices on their own. If enacted, we would expect interest rate volatility to increase, particularly for longer maturity Treasury securities. However, it's important to remember that the FOMC takes a true committee approach, so proposed policy prescriptions still must garner seven votes (out of 12 voters), which may be easier said than done.
A Geopolitical Shock
The escalation of the Iran conflict represents the second of three major tests in the first half, as it pushed oil prices higher and rippled quickly through the Treasury market. Since the conflict began through last week's re-escalation, the 10-year yield has risen by more than 50 bps, while the 2-year yield rose even more. Markets that began the year debating how many rate cuts were coming were suddenly pricing meaningful odds of a rate hike, with the assumed "neutral" policy rate (the level that neither stimulates nor restricts the economy) revised up toward 4%.
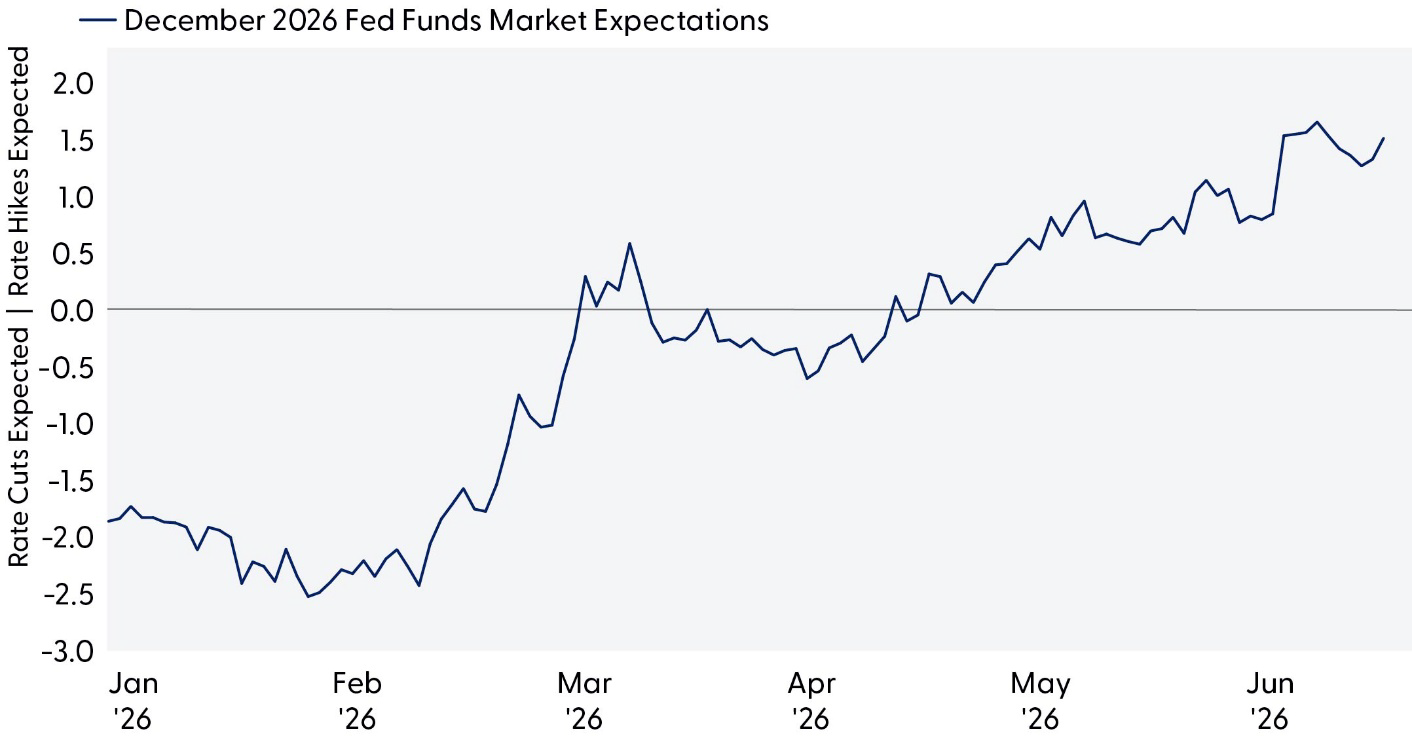
Source: LPL Research, Bloomberg, 06/30/26
Disclosures: Past performance is no guarantee of future results.
The remarkable part of this episode is what did not happen. Long-run inflation expectations, arguably the truest measure of the Fed's credibility, stayed firmly anchored, a sharp contrast to 2022. Most of the increase in Treasury yields reflects stronger expectations for economic growth (real yields), aided by the AI investment boom, rather than fear of uncontrolled inflation. Further, Treasury auctions have been absorbed in an orderly fashion, suggesting investors are comfortable with current yield levels. So, yields rose for largely constructive reasons: resilience, not distress.
This backdrop shapes our policy outlook. Even under new leadership, we expect the Fed to deliver, at most, one rate cut this year, likely in December, and contingent on the trajectory of the conflict and oil prices. At the same time, we believe the bar for a rate hike is higher still than current market expectations. Some of the recent hawkish rhetoric, in our view, is intended to let financial conditions do the tightening. With the neutral rate now seemingly higher than in past cycles, we do not expect rates to fall much from current levels. Accordingly, we are revising our year end 10-year Treasury yield forecast higher, from 3.75–4.25% to 4.00–4.50%.
A Historic Borrowing Wave
The third test is likely just beginning. The artificial intelligence (AI) story, long an equity market phenomenon, has migrated to fixed income. The hyperscalers (Amazon, Alphabet, Meta, Microsoft, and Oracle) once funded their ambitions almost entirely from internal cash flow. No longer. Building data centers, securing chips, and powering them requires sums beyond even their formidable cash flows. These companies issued roughly $110 billion of bonds in 2025, more than five times their 2023/2024 issuance trends, and estimates point to some $300 billion of AI-related investment-grade supply in 2026, with record total issuance approaching $2 trillion or more.
The borrowers themselves remain in excellent financial shape: hyperscaler leverage runs at a fraction of the typical investment-grade company, and new deals are routinely oversubscribed. Still, the sheer scale is changing the market's characteristics. Because data centers last decades, the bonds funding them are long dated, adding interest rate sensitivity to corporate bond indexes. Technology's share of the corporate bond market has climbed to around 10%.
That said, corporate bonds represent only about a quarter of the broad U.S. bond market (the Bloomberg Aggregate Bond Index). Moreover, the five hyperscalers still represent only 4% of the corporate bond index. And while the supply calendar will stay heavy, demand has proven persistent and fundamentals sound. That is why, despite these issuance trends, we do not expect credit spreads to widen meaningfully from current levels.
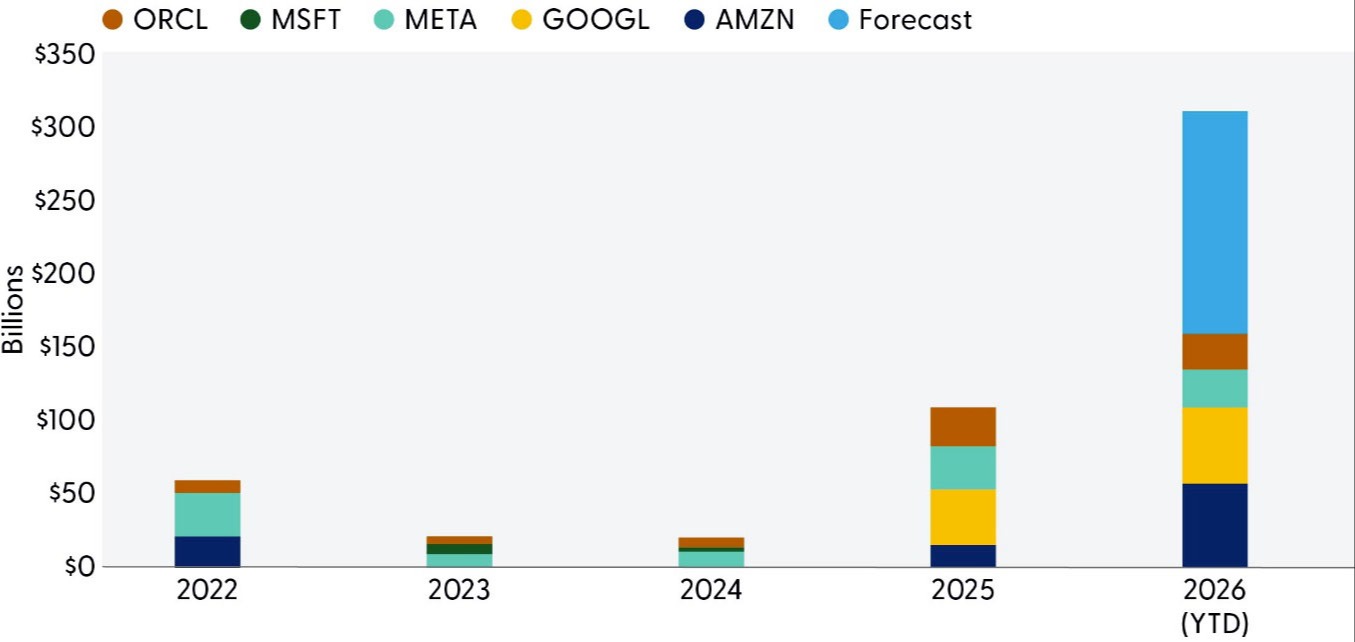
Source: LPL Research, Bloomberg, 06/30/26
Disclosures: Past performance is no guarantee of future results. Forecasts may not materialize as predicted.
Passing Grades, and What Comes Next
The bond market has absorbed a Fed transition (still early days, however), a geopolitical shock, and a historic wave of corporate borrowing without losing its footing. Our second-half outlook follows directly from that resilience: a higher-for-longer rate environment anchored by an elevated neutral rate, a patient Fed delivering one cut at most, 10-year yields ending the year between 4% and 4.50%, and credit spreads remaining contained. With little potential price appreciation through falling Treasury yields and/or spread tightening, we believe returns will once again come from attractive income opportunities.
Conclusion
To summarize, we have a few key expectations for the second half. Sticky inflation and resilient growth are expected to keep the Fed on their extended pause, leaving Treasury yields range-bound, with the 10-year likely finishing the year between 4% and 4.50% absent disinflation or clear economic weakening. In credit markets, tight credit spreads are likely to persist, though AI-driven borrowing by hyperscalers may pressure spreads modestly higher, and short- to-intermediate corporate bonds remain attractive for income-focused investors, in our view. More broadly, returns may continue to be income-driven as Treasury yields stay range-bound and credit spreads remain tight. Core and core plus models that overweight securitized markets (agency mortgage-backed securities (MBS), asset-backed securities (ABS), and select commercial mortgage-backed securities (CMBS)) and unconstrained strategies should perform well. We prefer Treasury Inflation-Protected Securities (TIPS) over nominal Treasuries as well.
Asset Allocation Insights
LPL's Strategic and Tactical Asset Allocation Committee (STAAC) maintains a neutral stance on duration relative to benchmarks. Our proprietary duration models show mixed signals, pointing toward neutral positioning, which strikes the appropriate balance. We would reconsider and potentially add duration if the 10-year yield were to push into the 4.75–5.00% range or if the curve steepened materially from current levels, which would represent an attractive entry point given the anchored expectations backdrop.
The STAAC maintains its recommendation for a tactical equity overweight and fixed income underweight. This reflects an expectation of an eventual long-term easing of geopolitical and commodity supply concerns as a result of the U.S.-Iran conflict, alongside a more cautious outlook for select areas of core fixed income. Overall, our tactical views emphasize a modest equity overweight expressed via a defensive factor tilt, a continued focus on quality bond sectors, caution in rate-sensitive fixed income sectors, and an ongoing allocation to diversifying strategies and alternatives. Within fixed income sectors, we remain underweight investment-grade corporates and MBS as spreads remain tight relative to historical standards, diminishing the risk/reward profile of the sectors.
Lawrence Gillum, CFA, Chief Fixed Income Strategist, LPL Financial
Brian Booe, Associate Analyst, Research, LPL Financial
Important Disclosures
This material is for general information only and is not intended to provide specific advice or recommendations for any individual. There is no assurance that the views or strategies discussed are suitable for all investors or will yield positive outcomes. Investing involves risks including possible loss of principal. Any economic forecasts set forth may not develop as predicted and are subject to change.
References to markets, asset classes, and sectors are generally regarding the corresponding market index. Indexes are unmanaged statistical composites and cannot be invested into directly. Index performance is not indicative of the performance of any investment and do not reflect fees, expenses, or sales charges. All performance referenced is historical and is no guarantee of future results.
Any company names noted herein are for educational purposes only and not an indication of trading intent or a solicitation of their products or services. LPL Financial doesn't provide research on individual equities.
All information is believed to be from reliable sources; however, LPL Financial makes no representation as to its completeness or accuracy.
All investing involves risk, including possible loss of principal.
US Treasuries may be considered "safe haven" investments but do carry some degree of risk including interest rate, credit, and market risk. Bonds are subject to market and interest rate risk if sold prior to maturity. Bond values will decline as interest rates rise and bonds are subject to availability and change in price.
The Standard & Poor's 500 Index (S&P500) is a capitalization-weighted index of 500 stocks designed to measure performance of the broad domestic economy through changes in the aggregate market value of 500 stocks representing all major industries.
The PE ratio (price-to-earnings ratio) is a measure of the price paid for a share relative to the annual net income or profit earned by the firm per share. It is a financial ratio used for valuation: a higher PE ratio means that investors are paying more for each unit of net income, so the stock is more expensive compared to one with lower PE ratio.
Earnings per share (EPS) is the portion of a company's profit allocated to each outstanding share of common stock. EPS serves as an indicator of a company's profitability. Earnings per share is generally considered to be the single most important variable in determining a share's price. It is also a major component used to calculate the price-to-earnings valuation ratio.
All index data from FactSet or Bloomberg.
This research material has been prepared by LPL Financial LLC.
For public use.
Member FINRA/SIPC.
RES-0007122-0526 Tracking #1138559| #1138561 (Exp. 07/27)